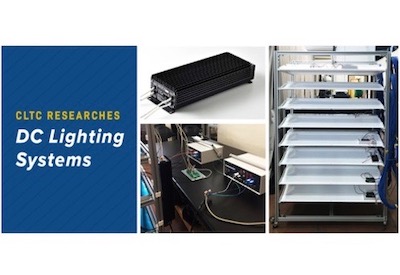
Evaluating Direct Current Lighting Systems
Sept 15, 2020
By Andrew Harper and Keith Graeber
The majority of building power distribution systems use alternating current (AC) sourced from a power grid. This significantly influences the design of direct current (DC) appliances including LED light sources and digital controls. With the proliferation of DC devices as standard design elements across many building technology categories, the interest in DC power distribution systems has increased significantly. In theory, DC power distribution can increase overall electrical system efficiency by eliminating losses associated with multiple AC-to-DC conversions. Therefore, centralized power supplies that support larger connected loads can be more efficient than distributed power supplies when powering the same total electrical load.* This increase in efficiency translates directly to reduced energy use and increased operational cost savings.
The California Lighting Technology Center (CLTC), sponsored by San Diego Gas & Electric, conducted a multi-year study to identify and evaluate DC lighting systems for commercial interior spaces. This study aimed to quantify DC lighting system electrical performance, validate manufacturer claims, and document benefits/challenges under both typical and worst-case design scenarios. The study included two components: 1) a market assessment of available commercial DC lighting systems, manufacturers and applications; and 2) a laboratory evaluation of representative DC lighting systems.
During the market assessment, CLTC identified commercial DC lighting systems available for purchase and reviewed the manufacturer’s product literature to assess their electrical performance in comparison to a traditional AC lighting system. To conduct the laboratory evaluation, CLTC purchased three representative DC lighting systems identified during the market assessment. The systems were installed under typical operating conditions and the electrical performance was evaluated as compared to a representative AC lighting system.
Market assessment
At the time of this study, CLTC identified 12 manufacturers with commercially available DC lighting systems. CLTC also contacted multiple lighting distributors to identify a commonly used, commercially available, AC lighting system to use as the baseline for the evaluation.
DC lighting systems are categorized into two types: Power-over-Ethernet (PoE) and Low Voltage Direct Current (LVDC). The selected DC systems are representative of the commercially available DC lighting system market segment identified during the market assessment, with PoE systems being the most common. CLTC selected two PoE systems and one LVDC system to evaluate as compared to one traditional AC system (Table 1). The two selected PoE systems use the same 480-W, eight-channel power switch. CLTC selected the LVDC and AC systems to fit approximately the same area served by the PoE systems. The LVDC system selection was also influenced by manufacturer responsiveness during the market assessment.
Table 1. Lighting systems selected for evaluation

The system architecture varied across the selected systems. All three DC lighting systems consisted of a power supply and luminaires. Additionally, DC Manufacturer 3’s system required a wall switch dimmer for dimming, and both of the PoE systems (DC Manufacturer 2 and 3) required additional control peripherals (gateway computer and router) for commissioning and control. The baseline AC system consisted of eight luminaires with dimmable drivers. The luminaires used with the PoE and AC systems were 2-ft-by-4-ft recessed LED troffers. The LVDC system utilized 2-ft-by-2-ft surface-mounted luminaires recommended by DC Manufacturer 1. These luminaires were chosen to maximize the load on the LVDC power supply while remaining within the study budget.
Laboratory evaluation
CLTC collected measurements to compare the electrical performance of the three DC systems to the baseline AC system. Each of the DC lighting systems evaluated were marketed as serving a “Floor/Large Space.” CLTC used computer modeling to estimate this as 1,750 sq ft or less in floor area based on the size of the DC power supply and wattage of typical luminaires. The tested DC lighting systems provided either 8 or 9 ports (8 for PoE, 9 for LVDC) with a total power output ranging from 226 to 480 watts. CLTC analyzed the electrical performance of each system at the space level only and did not consider generation or transmission losses occurring upstream of the space itself.
Each system’s overall electrical efficiency was calculated as the total output power of the system divided by the input power to the system. Ideal efficiency is 100%, meaning no power loss occurs anywhere in the system. In practice, power loss occurs at many points within a lighting system. For DC systems, power losses consist of 1) conversion losses (both AC-to-DC and DC-to-DC), 2) peripheral device losses (gateway computers, routers, etc.) and 3) line losses. For AC systems, power loss occurs at the LED driver (AC-to-DC conversion) and at peripherals, when included. Line losses for AC lighting systems are typically very small. For this evaluation, no AC system peripherals were required and line losses were assumed to be zero.
Measurements were taken with laboratory-grade meters before and after each power conversion point in the system, and at the beginning and the end of each conductor or cable carrying power. The electrical measurements for this study were taken under what could be considered worst-case scenarios for the DC lighting systems. Specifically, measurements were taken using the longest recommended cable runs from the power supply (or power switch) to the luminaires. Subsequently, CLTC used computer modelling to calculate cable lengths that are more realistic and the system efficiencies were recalculated accordingly. For each system, these losses were totaled and used to calculate the total system efficiency (Equation 1).
Equation 1. Definition of total system efficiency

Results
Analysis showed that the traditional AC system was more electrically efficient than the tested DC systems. Under typical operating conditions, the AC system had a total system efficiency of 86% (Figure 1) when luminaires operated at full output. The best performing DC systems operated at approximately 81% efficiency under the same conditions (using calculated cable lengths). For the tested DC systems, the losses due to cabling and required peripherals were more than the gains achieved by centralizing the output. The best performing DC systems operated at approximately 81% efficiency under the same conditions (using calculated cable lengths). For the tested DC systems, the losses due to cabling and required peripherals were more than the gains achieved by centralizing the AC-to-DC conversion in a single system power supply.
Figure 1. Electrical performance of AC and DC systems using average conductor lengths determined from computer modelling

The DC system efficiency was impacted by multiple factors. Power supply loading and cable length affected the DC systems efficiency the most. Due to standard line losses of CAT cables, the PoE system efficiency decreased as the cable length increased. When operating with the maximum recommended length of CAT cable (100 meters), the DC system efficiencies decreased an additional three to nine percent as compared to the AC system (Figure 2).
Figure 2. Electrical performance of AC and DC systems using maximum cable lengths recommended by manufacturer

Conclusions
CLTC analyzed DC systems up to 480 Watts of output power for this study, and the results show that at this power capacity the efficiency gains from the larger-scale conversion of AC-to-DC are less than the power losses due to additional DC-to-DC conversions, line losses and the load of the peripheral control equipment. In fact, AC-to-DC conversion losses were the highest source of power loss in each DC system by almost an order of magnitude with respect to the other sources of power loss (Table 2). It is possible that a DC lighting system with a centralized power supply greater than 480 watts could realize enough energy savings from its larger-scale AC-to-DC conversion to offset the losses from the additional DC-to-DC conversion and the power of the peripheral control equipment. Additional testing is needed to evaluate this product category.
Table 2. Power losses for each lighting system operating at maximum load

Next steps
DC lighting systems are well suited for use in emerging DC power transmission strategies, or DC microgrids. DC microgrids are capable of providing power directly from renewable resources to the appliance via an energy storage system, eliminating any AC-to-DC conversion losses. These DC microgrid systems do introduce losses from electrical inefficiencies in charging and discharging the electro-chemical storage devices. However, these energy storage systems provide grid resiliency and will continue to power the DC microgrid in the event of a power grid outage or lack of adequate power from renewables. Future research will determine if the use of DC lighting systems in a DC microgrid can offer significant energy savings over traditional AC lighting systems.
To learn more about this study, read the full report published by the Emerging Technologies Coordinating Council: www.etcc-ca.com/reports/laboratory-evaluation-dc-lighting-systems
Andrew Harper, PE, is an R&D engineer at CLTC. His work focuses on DC lighting, integrated building control systems and commercial daylighting technologies. Keith Graeber, PE, leads CLTC’s staff of lighting technology researchers and engineers. He supervises the development of next-generation, energy-efficient lighting systems and controls.
This article originally appeared in LD+A August 2020 issue, published by the IES. It is reprinted here with the permission of UCDavis.
* Thomas, Brinda A., Inês L. Azevedo, and Granger Morgan. 2012. “Edison Revisited: Should we use DC circuits for lighting in commercial buildings?” Energy Policy 45:399-411. doi: http://dx.doi.org/10.1016/j.enpol.2012.02.048.