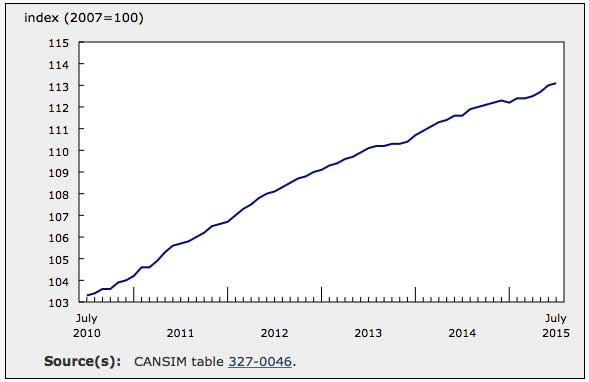
July New Housing Price Index Up 0.1%, After a 0.3% Increase in June
The combined region of Toronto and Oshawa was the top contributor to the increase, with prices up 0.3% over the previous month. Builders reported market conditions and higher labour costs as the main reasons for the gain.The census metropolitan area (CMA) of Hamilton (+0.6%) recorded the largest price increase in July. Builders cited market conditions as the primary reason for the advance, the largest in that CMA since June 2014.
Prices rose 0.4% in the CMA of Saskatoon following a 0.4% decrease the previous month. Builders returned to regular list pricing in July after reporting lower selling prices in June.
New housing prices rose 0.3% in the CMAs of St. John’s and London. Builders in St. John’s cited higher material and labour costs as well as higher cost of developed land as reasons for the increase. This was the largest price gain in that CMA since March 2014. In London, builders reported higher list prices as the main reason for the increase—the largest in that CMA since January 2015.
Prices increased 0.3% in Vancouver for the second consecutive month. Builders cited market conditions as the main reason for the advance.
Chart 1: New Housing Price Index
Prices were unchanged in 9 of the 21 metropolitan areas surveyed.
Kitchener-Cambridge-Waterloo, as well as the CMA of Calgary, recorded the largest price decreases (both down 0.3%) in July. Builders in both areas cited lower negotiated selling prices, as well as lower list prices to stimulate sales as the main reasons for the decline. This was the first price decrease in Kitchener-Cambridge-Waterloo since January 2014.
New home prices declined 0.1%in Halifax and St. Catharines-Niagara, as builders in both CMAs reported lower negotiated selling prices. This was the first price decrease in Halifax since July 2014, and the first decline in St. Catharines–Niagara since February 2015.
On a year-over-year basis, the NHPI rose 1.3% in July, following an identical increase in June.
Chart 2: Year over year price changes

The combined metropolitan region of Toronto and Oshawa posts the largest year-over-year price increase
The combined metropolitan region of Toronto and Oshawa was the top contributor and recorded the largest annual price increase in July, with prices up 3.4% over the same month last year. This was the largest year-over-year increase in that CMA since February 2013.
Other notable year-over-year increases were observed in Hamilton (+3.2%), Kitchener-Cambridge-Waterloo (+1.8%) and Vancouver (+1.6%). Year over year, prices have been steadily increasing in Vancouver for the past four months.
Calgary recorded an annual price increase of 0.3% in July. Year over year, prices in Calgary have been slowing since the start of 2015.
Among the 21 metropolitan areas surveyed, 5 posted year-over-year price declines in July: Regina (-1.8%), Victoria (-1.5%), Ottawa-Gatineau (-0.9%), Québec (-0.4%), as well as the combined metropolitan region of Saint John, Fredericton and Moncton (-0.1%).
Source: Statistics Canada, http://www.statcan.gc.ca/daily-quotidien/150910/dq150910c-eng.htm?cmp=mstatcan.


![Guide to the Canadian Electrical Code, Part 1[i], 26th Edition– A Road Map: Section 34](https://electricalindustry.ca/wp-content/uploads/2022/11/Guide-CE-Code-2.png)