Industrial Component Leads Non-Residential Building Permit Decline in May 2026
July 13, 2026
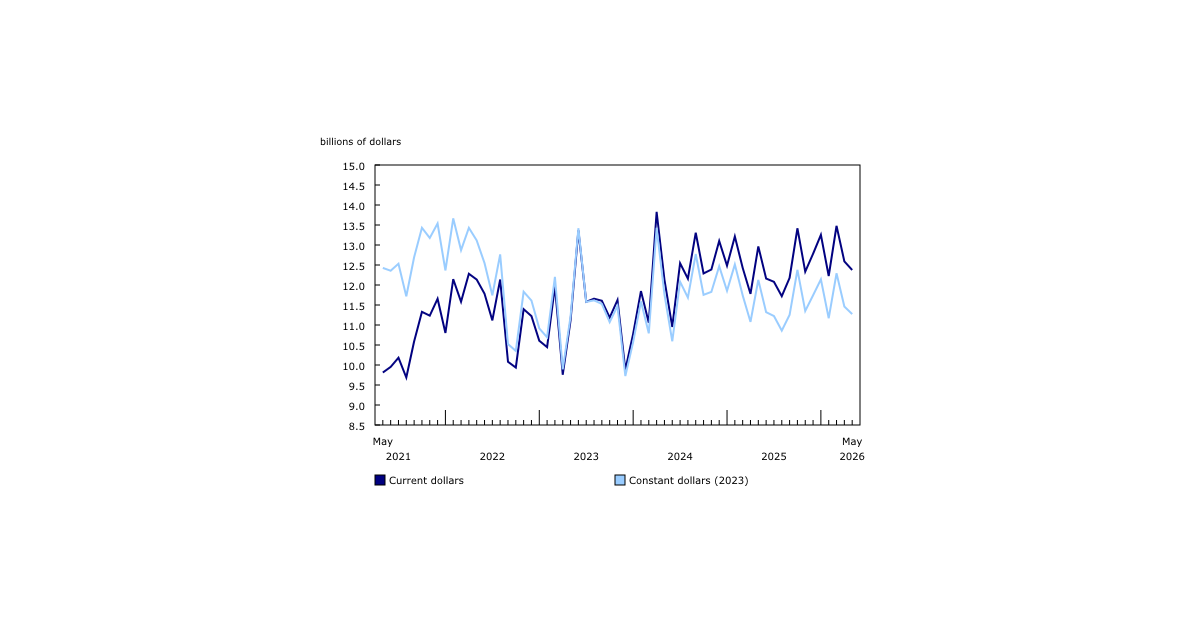
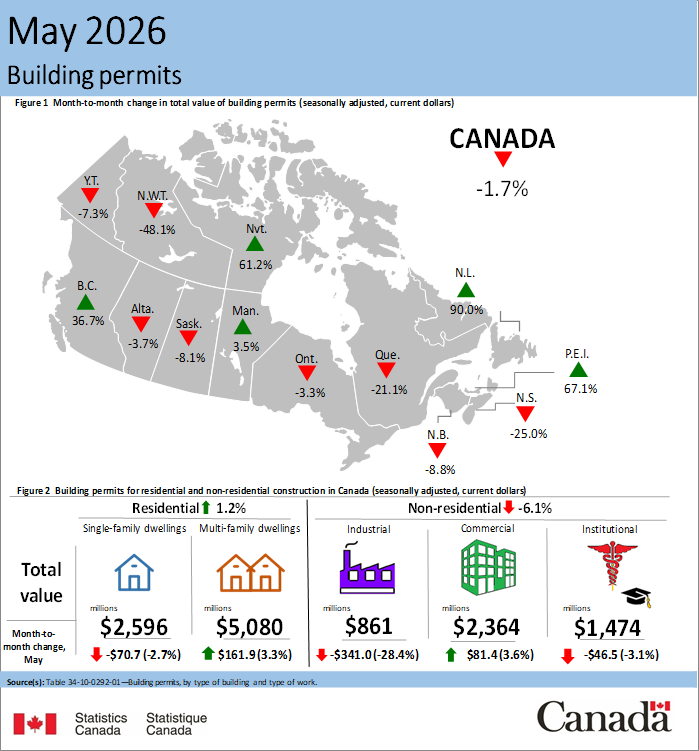
In May, the total value of building permits issued in Canada decreased $215.0 million (-1.7%) to reach $12.4 billion. The decline in construction intentions was due to the non-residential sector (-6.1%) and tempered by the residential sector (+1.2%).
On a constant dollar basis (2023=100), the total value of building permits issued in May decreased 1.6% from the previous month and was down 7.0% on a year-over-year basis.
Industrial component leads non-residential decline
The value of non-residential building permits fell by $306.1 million to $4.7 billion in May. The industrial component (-$341.0 million to $861.3 million) accounted for most of the decrease. Meanwhile, the commercial component (+$81.4 million to $2.4 billion) tempered the overall decline.
In May, losses in the industrial component were driven by Ontario (-$236.2 million), followed by Quebec (-$52.3 million) and Alberta (-$50.7 million). Overall, eight provinces and one territory contributed to the decrease.
The reduction in institutional construction intentions in May was driven by Ontario (-$240.2 million) and, to a lesser extent, Quebec (-$74.1 million). British Columbia (+$183.6 million) helped moderate the decline.
The growth in the commercial component in May was primarily attributable to British Columbia (+$183.1 million), followed by Ontario (+$62.9 million) and Newfoundland and Labrador (+$33.5 million). Quebec (-$183.0 million) tempered the increase.
Multi-unit component leads residential increase
Residential construction intentions rose $91.1 million to $7.7 billion in May. The increase in the multi-unit component (+$161.9 million to $5.1 billion) was partially offset by a decline in the single-family component (-$70.7 million to $2.6 billion).
In May, the growth in the multi-unit component was led by British Columbia (+$304.4 million) and supported by Ontario (+$235.0 million). The largest increases were recorded in the Vancouver (+$216.0 million) and Toronto (+$129.0 million) census metropolitan areas. Declines in Quebec (-$272.6 million) and Nova Scotia (-$79.2 million) moderated the gains.
The decrease in the single-family component in May was primarily attributable to Quebec (-$65.7 million), followed by Manitoba (-$19.5 million) and Alberta (-$13.8 million).
Across Canada, 20,200 multi-unit dwellings and 3,900 single-family dwellings (not seasonally adjusted) were authorized in May, down 0.6% from the previous month. From June 2025 to May 2026, the total number of multi-unit and single-family dwellings authorized was 301,400, down from 303,500 during the same period one year earlier.
To explore data using an interactive user interface, visit the Building permits: Interactive Dashboard.
For more information on construction, please visit the Construction statistics portal.
For more information on housing, please visit the Housing statistics portal.