New Hosing Price Index: List Prices and Market Conditions Drive Increase
April 20 2016
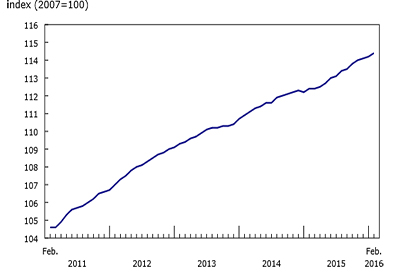
Chart 1: New Housing Price Index
The New Housing Price Index (NHPI) rose 0.2% in February, following a 0.1% increase in January. The advance was led by higher new home prices in Ontario and British Columbia. Of the metropolitan areas covered by the index, the combined region of Toronto and Oshawa (+0.4%) and Vancouver (+0.8%) were the top contributors to the national increase. Builders in both regions cited new list prices and market conditions as the main reasons for the advance. This was the largest monthly price increase in Vancouver since September 2009.
Charlottetown (+1.2%) recorded the largest monthly price gain. Builders reported higher material costs as the primary reason for the increase — the largest since July 2011.
Other significant gains occurred in
• Hamilton (+0.5%)
• St. Catharines-Niagara (+0.4%)
• London (+0.3%)
• Montreal (+0.3%)
• Kitchener-Cambridge-Waterloo (+0.2%)
• Victoria (+0.2%)
Builders reported higher material costs as the primary reason for the increases in Hamilton, Kitchener-Cambridge-Waterloo, London and Montréal. Builders in St. Catharines-Niagara and Victoria cited market conditions as the driving force behind the increases.
Prices were unchanged in 9 of the 21 metropolitan areas surveyed, including Ottawa-Gatineau and Regina. In Ottawa–Gatineau, higher material costs and new list prices were offset by declines attributable to market conditions. In Regina, land prices were up as a result of new city service fees and development charges, but the gains were offset by lower negotiated selling prices.
New housing prices fell in Calgary (-0.5%) and Saskatoon (-0.2%). Builders in Calgary reported market conditions as the main reason for the decrease — the largest since July 2011. In Saskatoon, builders cited lower negotiated selling prices as the primary reason for the decline.
New Housing Price Index, 12-month change
The NHPI increased 1.8% over the 12-month period ending in February, following an identical increase in January.
Chart 2: Toronto and Oshawa combined post the highest year-over-year price increase

The combined metropolitan region of Toronto and Oshawa (+4.4%) was the top contributor to the gain, recording the largest year-over-year price increase in February.
Other notable gains were observed in Vancouver (+4.0%), Hamilton (+3.4%) and Victoria (+0.2%). This was the first year-over-year increase in Victoria since September 2008 and the largest since April of that same year.
Among the 21 metropolitan areas surveyed, 5 posted year-over-year price declines in February: Saskatoon (-1.9%), Calgary (-1.3%), Regina (-0.7%), Québec (-0.7%) and Ottawa–Gatineau (-0.1%).
Source: Statistics Canada, www.statcan.gc.ca/daily-quotidien/160414/dq160414a-eng.htm.