Residential Construction Remained the Top Contributor to Underground Activity in 2018

Oct 28, 2020
The estimated gross domestic product (GDP) at market prices for underground economic activity in Canada reached $61.2 billion, or 2.7% of total GDP, in 2018.
The underground economy decreased 0.8% in real terms in 2018 on a year-over-year basis, compared with a year-over-year growth of 1.9% in 2017.
The underground economy is defined as consisting of market-based economic activities, whether legal or illegal, that escape measurement because of their hidden, illegal or informal nature. In this study, some illegal activities, such as those related to drugs (except cannabis) and prostitution, have been excluded.
It should be noted that unlicensed cannabis production and consumption was excluded from previous studies. However, following the legalization of recreational use of cannabis on October 17, 2018, the goods and services associated with licensed and unlicensed cannabis have been incorporated into the Canadian System of Macroeconomic Accounts.
To align with this change, unlicensed cannabis production and consumption have been added to these estimates, dating back to 2014. The inclusion of unlicensed cannabis resulted in an increase of 0.2 percentage points to the underground economy share of GDP in 2018.
From 2014 to 2018, the underground share of GDP varied between 2.7% and 2.9%. The share of GDP in the previous study (which excluded the production and consumption of unlicensed cannabis) varied between 2.2% and 2.7% from 1992 to 2013.
Although the underground economy data published today pre-date the COVID-19 pandemic, they provide an important benchmark to measure the full effect of the pandemic on the Canadian economy.
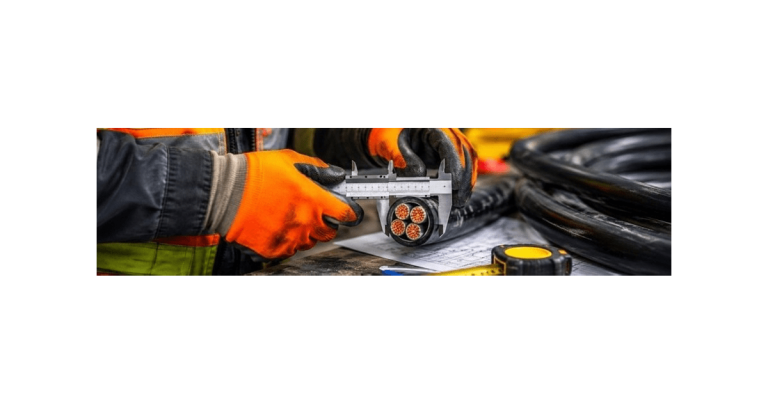
Residential construction remains the top contributor to underground activity
In 2018, four industries accounted for more than half of underground economic activity: residential construction (26.2%), retail trade (12.3%), finance, insurance, real estate, rental and leasing and holding companies (10.3%), and accommodation and food services (9.1%). These industries have been the main contributors to underground economic activity in Canada since this study began in 1992.
Wages and undeclared tips account for largest share of unreported income
Of the $61.2 billion in unreported income in 2018, the largest share went to employees (42.4%) in the form of labour compensation. Wages that are not accounted for in payroll records and tips on undeclared transactions were $26.0 billion, equivalent to 2.3% of official compensation of employees. The remaining portion of underground income went to unincorporated business owners (28.6%) and incorporated business owners (26.1%).
Alcoholic beverages, tobacco and cannabis products for non-medical use is the largest category for underground household expenditures
In 2018, underground economic activity associated with household final consumption expenditure was $40.4 billion, which accounted for 66.0% of the underground economy. Of the household final consumption expenditure in the underground economy, 29.2% was associated with household purchases of alcoholic beverages, tobacco and cannabis, 20.6% was spent on food, beverage and accommodation services, and a further 17.2% was used on housing, water, electricity, gas and other fuels. The household-purchased alcoholic beverages, tobacco and cannabis from the underground economy accounted for 25.1% of the official total economy household expenditure. The food, beverage and accommodation services accounted for 9.3%.
Underground economy by province and territory
The total value of underground economic activity in 2018 was highest in the four largest economies: Ontario ($22.8 billion), Quebec ($14.2 billion), British Columbia ($10.8 billion) and Alberta ($6.2 billion). These four economies accounted for 88.4% of total underground economy, while the total GDP created by these four provinces accounted for 87.1% of total economy.
As a proportion of total economy GDP in 2018, the underground economic activity was the largest in British Columbia (3.7%) and in Prince Edward Island (3.3%), while Nunavut had the smallest share (0.5%). The relative size of the underground economy in a province or territory often reflects the difference in economic structure in that province or territory. Industries that are more prone to underground activity, such as crop production, residential construction, and accommodation and food services, have a larger economic presence in provinces and territories that have a higher share of underground economic activity.
This study assumes that there is no underground economic activity in the government sector, which makes up a large share of the economies of Nunavut and the Northwest Territories.
Source: Statistics Canada, www150.statcan.gc.ca/n1/daily-quotidien/201023/dq201023a-eng.htm?CMP=mstatcan