Building Permits in Canada Up 2.1% for February, Residential Construction Down 2.9%

April 5, 2021
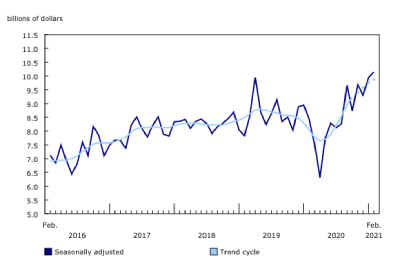
The total value of building permits issued in February broke the $10 billion mark for the first time, as a jump in the non-residential sector more than offset the decline in the residential sector.
All non-residential components record gains
The non-residential sector jumped 14.2% to $3.3 billion in February with all three components posting gains. Despite the large jump in this sector, the level remained about 13% below the peak reached in April 2019.
Institutional permits saw their largest value increase since June 2020, as the total for this component climbed $226 million to $1.0 billion. With several permits being issued for long-term care facilities and a hospice, Ontario (+44.4%) and Alberta (+107.6%) led the way.
The commercial component increased 11.4% to $1.7 billion, the highest value since September 2020. Most of the gain was the result of high-value permits being issued for additions and renovations to commercial buildings in Ontario and Alberta. Building intentions in the commercial component have not been this high in Alberta since December 2019.
Municipalities issued permits worth $544 million for industrial buildings in February, up 1.9% from the previous month. Seven provinces recorded a rise in this component, led by Ontario.
Residential gains in British Columbia not enough to offset declines in Ontario and Alberta
Residential construction intentions decreased 2.9% to $6.8 billion in February, following a record month in January.
In British Columbia, several high-value permits were issued for multi-family dwellings (+59.2%), including two for the University District condo development in the city of Surrey. However, declines in six provinces, including Ontario (-23.9%) and Alberta (-39.2%), pulled this component lower at the national level, with the total dropping 4.9% to $3.3 billion.
Building permits for single-family homes dipped 1.0% to $3.5 billion, although they remained at historically high levels, with Ontario ($1.5 billion) and Prince Edward Island ($29.1 million) reporting record highs. This marked the third consecutive month of record-setting numbers for Ontario, while the building permits in Prince Edward Island were close to double the values typically observed prior to the pandemic.
From January 2018 to the end of 2020, the value for multi-family dwellings had exceeded that of single-family homes. However, shortly after the start of the pandemic, the gap between these two components steadily closed. By January 2021, the value of permits for single-family homes had once again surpassed that of multi-family dwellings and continued to do so in February.
To explore the impact of COVID-19 on the socioeconomic landscape, please consult the Canadian Economic Dashboard and COVID-19.
For more information on housing, please visit the Housing Statistics Portal.
Statistics Canada has a Housing Market Indicators dashboard. This web application provides access to key housing market indicators for Canada, by province and by census metropolitan area. These indicators are updated automatically with new information from monthly releases, giving users access to the latest data.
Go HERE for more information, figures, and graphs


![Guide to the Canadian Electrical Code, Part 1[i], 26th Edition– A Road Map: Section 56](https://electricalindustry.ca/wp-content/uploads/2022/11/Guide-CE-Code-2-768x432.png)


![Guide to the Canadian Electrical Code, Part 1[i], 26th Edition– A Road Map: Section 56](https://electricalindustry.ca/wp-content/uploads/2022/11/Guide-CE-Code-2.png)


