Institutional Construction Intentions Lead Growth in Non-Residential Sector, March Building Permits
May 21, 2026
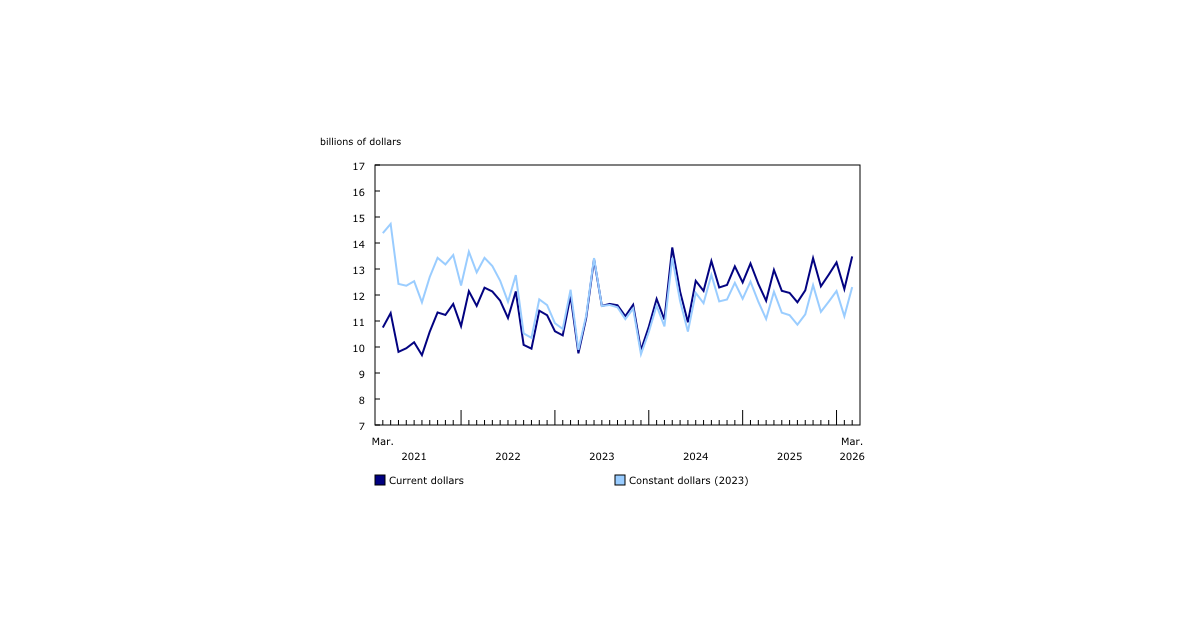
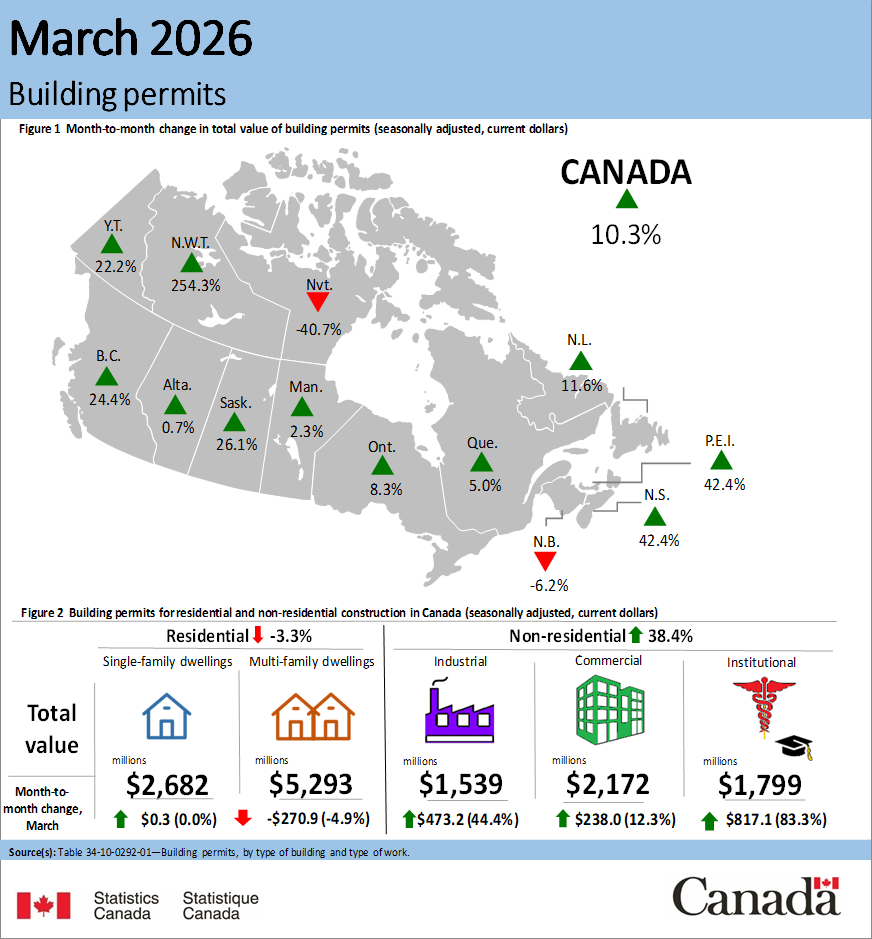
In March, the total value of building permits issued in Canada increased $1.3 billion (+10.3%) to $13.5 billion. The increase in construction intentions was led by the non-residential sector (+$1.5 billion) and tempered by the residential sector (-$270.6 million).
On a constant dollar basis (2023=100), the total value of building permits issued in March rose 10.1% from the previous month and was up 4.8% on a year-over-year basis.
Institutional construction intentions lead growth in non-residential sector
The value of non-residential building permits grew $1.5 billion to $5.5 billion in March. The increase was led by the institutional component (+$817.1 million to $1.8 billion), while the industrial (+$473.2 million to $1.5 billion) and the commercial (+$238.0 million to $2.2 billion) components contributed to a lesser extent.
In March, the gains in the institutional component were bolstered by growth in British Columbia (+$665.5 million) and concentrated in the Vancouver census metropolitan area, with newly approved building permits for medical institutions.
The rise in the industrial component in March was primarily attributable to Ontario (+$510.8 million) and supported by Quebec (+$113.6 million).
Meanwhile, seven provinces and two territories contributed to the increase in the commercial component (+$238.0 million).
Multi-family construction intentions weigh down residential sector
In March, residential construction intentions in Canada decreased $270.6 million (-3.3%) to $8.0 billion. The national decline was driven by the multi-family component, which fell $270.9 million to $5.3 billion. The single-family component saw virtually no change month over month and remained at $2.7 billion.
The decline in the multi-family component in March was driven by Ontario (-$393.1 million) and Quebec (-$163.5 million). Meanwhile, gains in British Columbia (+$90.7 million), Nova Scotia (+$83.8 million) and four other provinces and one territory tempered the decline.
In the single-family component, a large decline in Alberta (-$65.9 million) in March was offset by increases in Ontario (+$33.2 million), Saskatchewan (+$22.9 million) and British Columbia (+$19.4 million), leading to stagnant construction intentions in March.
Quarterly review: Residential sector leads increase in first quarter
In the first quarter of 2026, the total value of building permits increased $445.7 million to $39.0 billion, up 1.1% from the previous quarter. On a constant dollar basis (2023=100), the total value of building permits was up 0.5% to $35.6 billion.
The remainder of this release will use constant dollars (2023=100).
The residential sector grew $514.5 million (+2.4%) to $22.2 billion in the first quarter. The single-family component increased $349.8 million to $7.4 billion after four consecutive quarterly declines. Gains in single-family construction intentions were driven by Ontario (+$142.8 million) and Quebec (+$110.6 million).
Multi-family construction intentions were up $164.7 million to $14.6 billion in the first quarter, with Ontario (+$392.3 million) and Quebec (+$186.1 million) leading the increase. Alberta (-$548.0 million) moderated the gains.
Nationwide, a total of 68,500 single-family and multi-family units (not seasonally adjusted) were authorized for construction in the first quarter, down from the 71,000 units authorized during the same period one year earlier.
Non-residential construction intentions decreased $347.4 million to $13.4 billion in the first quarter. The commercial component fell $813.7 million to $5.8 billion, marking the largest quarterly decline since the fourth quarter of 2020. The decline recorded in the first quarter of 2026 was supported by the institutional component (-$403.9 million). Meanwhile, the industrial component (+$870.2 million) tempered declines.
To explore data using an interactive user interface, visit the Building permits: Interactive Dashboard.
For more information on construction, please visit the Construction statistics portal.
For more information on housing, please visit the Housing statistics portal.