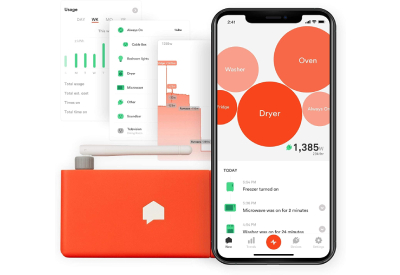
Sense Home Energy Monitor Adds Carbon Intensity Tracking to its Mobile App

October 1, 2021
Sense recently announced that homeowners can use their Sense app to find out when the electricity coming into their home is cleanest or dirtiest and take steps to minimize carbon emissions. Sense debuted a new feature that shows the carbon intensity, a measure of carbon emissions that changes dynamically as the power grid taps different energy sources.
In addition to tracking the home’s carbon usage in real time, the Sense app has a look-ahead view that forecasts the carbon intensity (CI), so users can plan high energy tasks, such as laundry, dishwashing or charging electric vehicles, for times when carbon emissions will be lowest, reducing their home’s overall carbon footprint.
In the app, users can also see a breakdown of the fuel types that are powering the home right now. The energy sources on the utility grid vary widely from region to region, and regions change their fuel mix over the course of a day, creating variations in CI.
The new CI feature is included in the Sense app for the Sense Home Energy Monitor and Sense Solar. It’s also included in all Sense-enabled products, such as the Square D™ edition of the Sense app for the Wiser Energy™ Home Power Monitor and the Square D™ Energy Center from Schneider Electric.
What is Carbon Intensity?
Carbon intensity is simply the amount of carbon dioxide emitted to generate a specific unit of power. The average CI across the country’s utility grid is approximately 1 lb/kWh, which is roughly equivalent to the CI for natural gas. Consumers can lower their overall climate change impact by being aware of CI and shifting energy use to the times when the grid uses more green power.
In most regions of the country, the carbon intensity of electricity generated by utility power plants varies throughout the day. At some times of day, such as when solar and wind are generating lots of power, carbon emissions are low. During other times, power may come from sources that emit more carbon, like coal or natural gas power plants, increasing the carbon intensity of the power on the grid.
In regions that rely primarily on a single, continuous power source, like hydro or natural gas, the carbon intensity varies only slightly, while in others with diverse power sources, the carbon intensity (CI) can rise and fall over the course of a day or week.
How Sense Reduces Carbon Emissions
The variability in CI offers an opportunity for Sense users to actively reduce their own home’s impact on carbon emissions. In the Sense app, users can see their average CI and can see the current CI of the power they are using, which is based on dynamic data from the utility grid’s regional balancing authority. The Sense app also shows a projection of carbon peaks and valleys over the next 12 hours. By scheduling activities when the CI from the grid is lowest, Sense users can reduce their own home’s CI score and impact carbon emissions.
To provide this new functionality, Sense has partnered with Singularity and has integrated with their Carbonara platform for both real-time and projected CI. Carbonara analyzes and provides carbon intensity data for 30 grid balancing authorities across the country.
The Sense app already has several features that help homeowners reduce their home’s energy usage and carbon footprints, including:
- Comparison of the home’s HVAC efficiency versus similar homes;
- Comparison of Always On usage from idle devices such as consumer electronics versus similar homes; Always On uses 23% of the electricity in the average household
- Alerts when there are significant changes in energy usage;
- The ability to set goals to match the family’s budget;
- Sense’s advanced machine learning, which identifies individual devices, including common household gadgets and appliances, tells you if they’re on or off, and reports on their energy usage, so you can find and replace energy hogs;
- Integrations with smart plugs to track and control devices; and
- Flex Add-on Sensors for keeping track of energy usage by major appliances.
How Energy Smart Homes Can Address Climate Change
In the future, smart homes will be able to take advantage of these carbon intensity fluctuations automatically by responding to real-time signals from the utility grid. Said Sense CEO Mike Phillips: “Since the Sense app now knows the carbon intensity of power from the grid, we can start to automate activities in the home to take place when carbon intensity is low. For instance, in the future, Sense users will be able to schedule their dishwasher or EV charger to run when the CI is lowest. Smart homes can know the preferences of the residents (for instance, that the EV needs to be charged and ready to drive by 7am) and will take into account CI, energy costs, and constraints of the grid to find the right times to use energy, resulting in carbon and cost reductions and contributing to a more reliable power grid. This becomes increasingly important as we electrify our homes and cars, and as the grid uses more and more renewables.”
“Homes are on track to become the single-largest consumer of electricity and homeowners realize that many of the resources currently being consumed to produce that electricity are negatively impacting our environment,” said Michael Mahan, Vice President, Home & Distribution North America, Schneider Electric. “Now greater energy intelligence is being built into homes, including smart electrical panels, providing information and tools that allow homeowners to modify their behavior, empowering them to impact change for the betterment of the environment and their electricity bill.”


![Guide to the Canadian Electrical Code, Part 1[i], 26th Edition– A Road Map: Section 56](https://electricalindustry.ca/wp-content/uploads/2022/11/Guide-CE-Code-2.png)


