Quarter by Quarter, Employment Inches Upward
April 14 2016
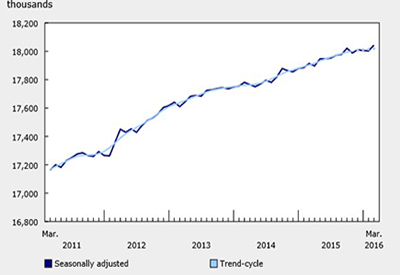
After three months of little change, employment increased by 41,000 (+0.2%) in March, lowering the unemployment rate by 0.2 percentage points to 7.1%. With the gains in March, employment grew by 0.2% in the first quarter (+33,000). This was the fourth consecutive quarter with 0.2% employment growth. In the 12 months to March, employment increased by 130,000 (+0.7%), the result of growth in full-time work. Most of growth occurred among people aged 25 to 54.
Over the same period, the number of hours worked increased by 1.2%.
Chart 1: Employment

In March, employment increased among men and women aged 25 to 54, while there was little change among the other demographic groups.
There were more people employed in Alberta, Manitoba, Nova Scotia and Saskatchewan. At the same time, employment declined in Prince Edward Island and was little changed in the other provinces.
Employment increased in health care and social assistance, accommodation and food services, professional, scientific and technical services as well as ‘other services.’ In contrast, there were fewer people employed in manufacturing.
The number of private sector employees increased in March, while there was little change in the number of public sector employees and self-employed workers.
Adjusted to U.S. concepts, the unemployment rate in Canada was 6.1% in March versus 5.0% in the United States.
Chart 2: Unemployment rate

More men and women aged 25 to 54 employed
For people aged 25 to 54, employment rose by 40,000 in March, with gains of 22,000 among women and 18,000 among men. However, on a year-over-year basis, employment among 25- to 54-year-olds was little changed. In March, the unemployment rate for men in this age group declined 0.2 percentage points to 6.7%, while for women it was little changed at 5.5%.
For youths aged 15 to 24, employment held steady in March, and the unemployment rate was 13.4%. On a year-over-year basis, youth employment fell by 60,000 (-2.4%), while their population declined by 44,000 (-1.0%).
Employment among people aged 55 and older was little changed in March, and their unemployment rate was 6.0%. In the 12 months to March, employment for this group increased by 149,000 (+4.2%). Employment growth for men and women aged 55 and older has been driven by growth in their population.
Provincial summary
In March, employment in Alberta rose by 19,000, driven by increases in retail and wholesale trade, and the unemployment rate fell 0.8 percentage points to 7.1%. On a year-over-year basis, employment in the province was little changed, but the unemployment rate was up 1.5 percentage points as more people were looking for work. Despite the employment increase in March, the total number of hours worked decreased by 0.7%, continuing on a downward trend that began in early 2015.
Employment in Manitoba increased by 5,500 in March, and the unemployment rate held steady at 6.0% as more people participated in the labour market. This unemployment rate was the lowest among all the provinces. Despite more Manitobans working in March, employment in the province was little changed from 12 months earlier.
In Nova Scotia, employment increased by 3,400 in March. As more people participated in the labour market, the unemployment rate held steady at 9.1%. Despite the increase in March, employment in the province has been on a downward trend since the fall of 2015.
In March, employment rose by 2,800 in Saskatchewan; however, the unemployment rate increased 0.3 percentage points to 6.2% as more people searched for work.
Compared with 12 months earlier, employment in the province was down slightly. Over the same period, the unemployment rate was up 1.7 percentage points—the result of more people looking for work.
Employment in Prince Edward Island declined by 700, and the unemployment rate was 11.0%. In the 12 months to March, employment in the province decreased by 2,300 (-3.1%).
Employment in British Columbia was little changed in March; however, on a year-over-year basis, gains totalled 72,000 or 3.2% — still the fastest growth rate among all the provinces. In March, the unemployment rate was little changed at 6.5%, though it was up 0.6 percentage points compared with a year earlier, as more people searched for work.
In Ontario, employment was also little changed in March, and the unemployment rate stayed at 6.8%. On a year-over-year basis, employment in the province increased by 86,000 or 1.2%, the second highest rate of growth among the provinces. All of the gains were in full-time work.
There was little change in employment in Quebec on both a monthly and a year-over-year basis. The unemployment rate was 7.5% in March.
Industry perspective
In March, employment in health care and social assistance increased by 25,000, bringing total gains to 77,000 (+3.4%) on a year-over-year basis.
There were also more workers in accommodation and food services (+18,000). In the 12 months to March, however, the number of people employed in this industry was down 27,000 (-2.2%).
There were 12,000 more people working in professional, scientific and technical services in March. Compared with the same month a year earlier, gains for the industry totalled 52,000 or 3.8%, the fastest year-over-year growth rate of all industries.
In ‘other services,’ such as those related to civic and professional organizations, as well as repair and maintenance, employment increased by 9,900. In the 12 months to March, however, the number of people working in this industry was little changed.
In contrast, employment in manufacturing decreased by 32,000 in March, with losses in Ontario, Quebec, Alberta and British Columbia. On a year-over-year basis, employment in the industry was little changed, as gains in Ontario and Nova Scotia were offset by losses in Alberta.
The number of employees in the private sector increased by 65,000 in March, bringing year-over-year gains to 109,000 (+0.9%). Both on a monthly and year-over-year basis, there was little change in the number of public sector employees and self-employed workers.
Canada-United States comparison
Adjusted to U.S. concepts, the unemployment rate in Canada was 6.1% in March versus 5.0% in the United States. Compared with March 2015, the unemployment rate increased by 0.2 percentage points in Canada, while it declined by 0.5 percentage points in the United States.
The labour force participation rate in Canada was 65.8% in March, and 63.0% in the United States. Compared with March 2015, the labour force participation rate in Canada edged down 0.1 percentage points, while in the United States it increased by 0.3 percentage points.
In March, the U.S.-adjusted employment rate in Canada stood at 61.8%, compared with 59.9% in the United States. On a year-over-year basis, the employment rate in Canada declined by 0.2 percentage points, while in the United States, it increased by 0.6 percentage points.
Source: Statistics Canada


![Guide to the Canadian Electrical Code, Part 1[i], 26th Edition– A Road Map: Section 12](https://electricalindustry.ca/wp-content/uploads/2022/11/Guide-CE-Code-2-768x432.png)

![Guide to the Canadian Electrical Code, Part 1[i], 26th Edition – A Road Map: Section 26](https://electricalindustry.ca/wp-content/uploads/2022/11/Guide-CE-Code-2.png)