June New Housing Price Index Rises 0.3% Nationally
The New Housing Price Index (NHPI) rose 0.3% in June, largely as a result of gains in Ontario. This was the third consecutive monthly price increase for the Canada-level index.The combined metropolitan region of Toronto and Oshawa (+0.6%) was the top contributor, recording the largest monthly price advance among the census metropolitan areas (CMAs) covered by the survey. Builders reported market conditions, higher material and labour costs, as well as higher land development costs as the reasons for the increase.
The combined metropolitan region of Saint John, Fredericton and Moncton and the CMA of Winnipeg both recorded price increases of 0.5%. Builders in Saint John, Fredericton and Moncton cited higher material costs as the main reason for the price increase—the largest in that CMA since September 2012. Builders in Winnipeg reported higher land development costs as the main reason for the gain.
For the second month in a row, new home prices increased by 0.4% in the CMA of Hamilton. Builders reported market conditions as the main reason for the advance.
New housing prices rose 0.3% in the CMAs of Kitchener-Cambridge-Waterloo and Vancouver. Builders in both areas cited market conditions as the main reason for the advance. The increase in Kitchener-Cambridge-Waterloo followed three consecutive months of no change.
For the first time this year, new housing prices were up in the CMA of Calgary (+0.1%). Higher land prices were largely offset by builders reducing prices because of market conditions.
Prices were unchanged in 8 of the 21 metropolitan areas surveyed.
The CMA of Saskatoon (-0.4%) recorded the largest price decrease in June. Builders cited lower negotiated selling prices as well as lower list prices to stimulate sales as the main reasons for the decline. The decline followed two straight months of increases.
In Charlottetown, new housing prices fell 0.2% for a second consecutive month, as builders reduced prices to clear the inventory of homes.
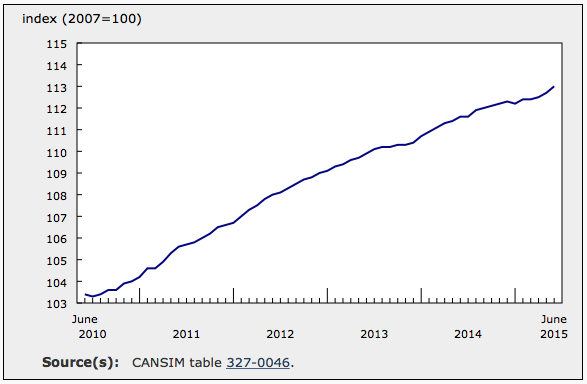
On a year-over-year basis, the NHPI rose 1.3% in June, up slightly from the 1.2% increase in May.
The combined metropolitan region of Toronto and Oshawa was the top contributor and recorded the largest annual price increase in June, with prices up 3.0% over the same month last year. This was the largest year-over-year gain in that CMA since March 2013.
Other notable year-over-year increases were observed in Hamilton (+2.8%), Kitchener–Cambridge–Waterloo (+2.2%), Winnipeg and Vancouver (both up 1.0%). Calgary recorded an annual price increase of 0.7% in June. Year-over-year increases in that CMA have been slowing since the start of the year.
Among the 21 metropolitan areas surveyed, 6 posted year-over-year price declines in June: Regina (-1.8%), Victoria (-1.5%), Ottawa–Gatineau (-1.0%), the combined metropolitan region of Saint John, Fredericton and Moncton, as well as Québec and Saskatoon (all three down 0.3%).
Source: Statistics Canada, http://www.statcan.gc.ca/daily-quotidien/150813/dq150813b-eng.htm?cmp=mstatcan.