Industrial Construction Intentions Drive Increase in Non-Residential Sector in January
March 13, 2026
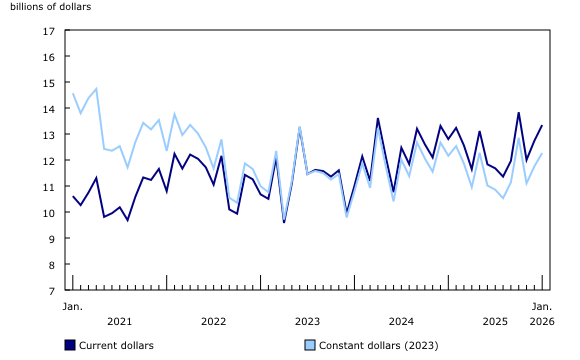
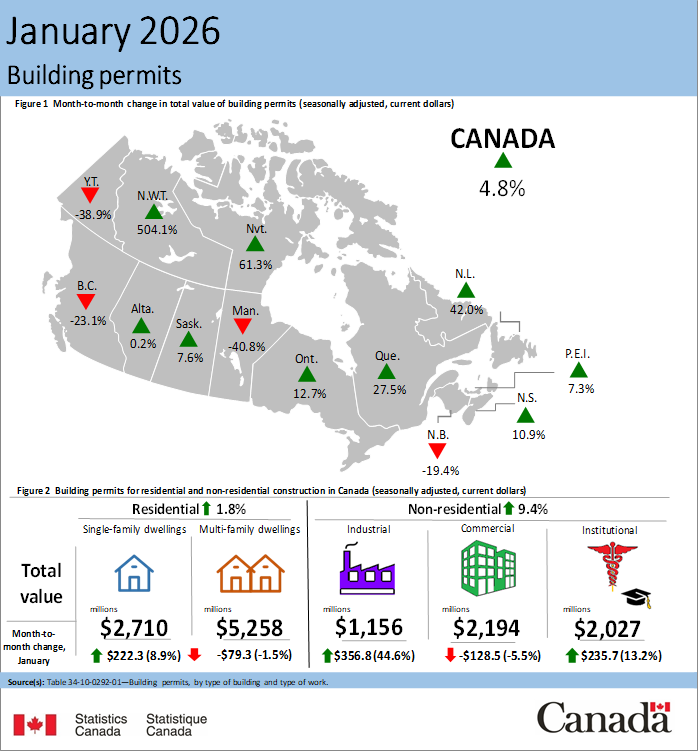
In January, the total value of building permits issued in Canada increased $607.0 million (+4.8%) to $13.3 billion. The increase was led by the non-residential sector (+$464.0 million) and supported by the residential sector (+$143.0 million).
On a constant dollar basis (2023=100), the total value of building permits issued in January rose 4.3% from the previous month and was up 0.8% on a year-over-year basis.
Industrial construction intentions drive increase in non-residential sector
Non-residential construction intentions rose 9.4% to $5.4 billion in January. The industrial component (+$356.8 million to $1.2 billion) drove the monthly increase, marking the largest month-over-month growth since July 2024. The institutional component supported the gains, increasing $235.7 million to $2.0 billion in January 2026. Meanwhile, the commercial component declined $128.5 million to $2.2 billion.
The gains in the industrial component in January were driven by Quebec (+$182.6 million), followed by Ontario (+$105.3 million). Construction intentions for new transportation terminals in the Toronto census metropolitan area (CMA) helped support the growth. In total, eight provinces contributed to the overall industrial component growth.
The institutional component was bolstered by growth in Ontario (+$618.1 million), which was driven by the Toronto CMA (+$997.6 million) as approved building permits for a new medical institution valued at over $800 million supported the increase. These gains were moderated by declines in six provinces and one territory.
The commercial component declined $128.5 million in January, led by Ontario (-$186.0 million). Meanwhile, Quebec (+$91.2 million) tempered losses.
Single-family component drives residential sector growth
Residential construction intentions rose $143.0 million to $8.0 billion in January. Gains in the single-family component (+$222.3 million to $2.7 billion) were moderated by a decline in the multi-unit component (-$79.3 million to $5.3 billion).
The growth in the single-family component was led by Ontario (+$85.8 million), followed by Quebec (+$55.3 million). In total, nine provinces and two territories contributed to this increase.
Losses in the multi-unit component were primarily attributed to Manitoba (-$230.3 million), British Columbia (-$155.0 million) and Alberta (-$99.7 million), while large gains in Quebec (+$362.2 million) tempered the decline.
Nationwide, a total of 21,400 multi-unit dwellings and 4,000 single-family dwellings were authorized in January, reflecting an overall decrease of 1.8% from the previous month. From February 2025 to January 2026, the total number of multi-family dwellings authorized was 256,500, up from 241,800 during the previous 12-month period.