Renewable Energy Breaks Growth Record In 2015

The 2016 edition of the world’s most comprehensive, up-to-date and accessible figures on renewable energy capacity has just been released by the International Renewable Energy Agency (IRENA).
Renewable Energy Capacity Statistics 2016, which contains 13,546 data points from more than 200 countries and territories, finds that renewable power generation capacity grew 8.3% in 2015, the highest rate ever recorded. Overall, capacity has increased by roughly one-third over the last five years, with most of this growth coming from new installations of wind and solar energy.
2015 highlights by region
In terms of regional distribution, the fastest growth came in developing countries.
- Central America and the Caribbean expanded at a rate of 14.5%.
- 58% of new additions came from Asia, where capacity expanded at a rate of 12.4%.
- Capacity increased by 24 GW (5.2%) in Europe and 20 GW (6.3%) in North America.
2015 highlights by technology

- Wind power grew 63 GW (17%) thanks to declines in onshore turbine prices of up to 45% since 2010. About 95% of wind capacity is now located in Asia, Europe and North America; and 90% of new capacity was installed in those regions in 2015 (57.1 GW).
- Solar increased 47 GW (26%) thanks to price drops of up to 80% for solar PV modules. The major solar development in 2015 was the 48% increase in solar capacity in Asia. An increase of 8 GW in North America also surpassed the level of new installations in Europe (7.6 GW) for the first time.
- Hydropower capacity increased by 35 GW (3%). three-quarters of new hydro capacity was installed in Brazil, China, India and Turkey (26.3 GW in total).
- Bioenergy increased roughly 5%. Almost 40% of bioenergy capacity is in Europe, with another 30% in Asia and the remainder in North and South America.
- Geothermal increased roughly 5% (600 MW) in 2015. Four countries (Italy, Mexico, Turkey and the United States of America) accounted for almost all of this increase
The full data set is continually updated in the “Data and Statistics” section of IRENA’s knowledge portal, REsource. Through this portal, users can compare countries and create and download their own data selections as charts, graphs or spreadsheet tables. The renewable power capacity data represents the maximum net generating capacity of power plants and other installations that use renewable energy sources to produce electricity. For most countries and technologies, the data reflects the capacity installed and connected at the end of the calendar year. Data has been obtained from a variety of sources, including an IRENA questionnaire, official national statistics, industry association reports, consultant reports and news articles.
Find out more about Renewable Energy Capacity Statistics 2016 www.irena.org/menu/index.aspx?mnu=Subcat&PriMenuID=36&CatID=141&SubcatID=1719.
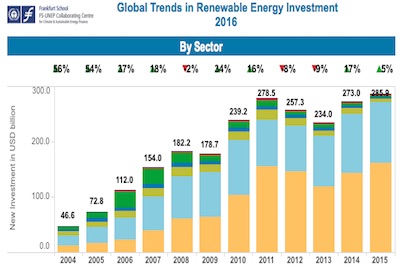
Chart source: Frankfurt School-UNEP Centre/Bloomberg New EnergyFinance (2016), Global Trends in Renewable Energy Investment


![Guide to the Canadian Electrical Code, Part 1[i], 26th Edition– A Road Map: Section 56](https://electricalindustry.ca/wp-content/uploads/2022/11/Guide-CE-Code-2.png)


